Can Wonky Cell Signals Help Track Wildfire Smoke?
A hazy atmosphere makes data ricochet all over the place. Now scientists think they can use that signal to better predict dangerously smoky air.
This story was originally published in Wired and appears here as part of our Climate Desk collaboration.
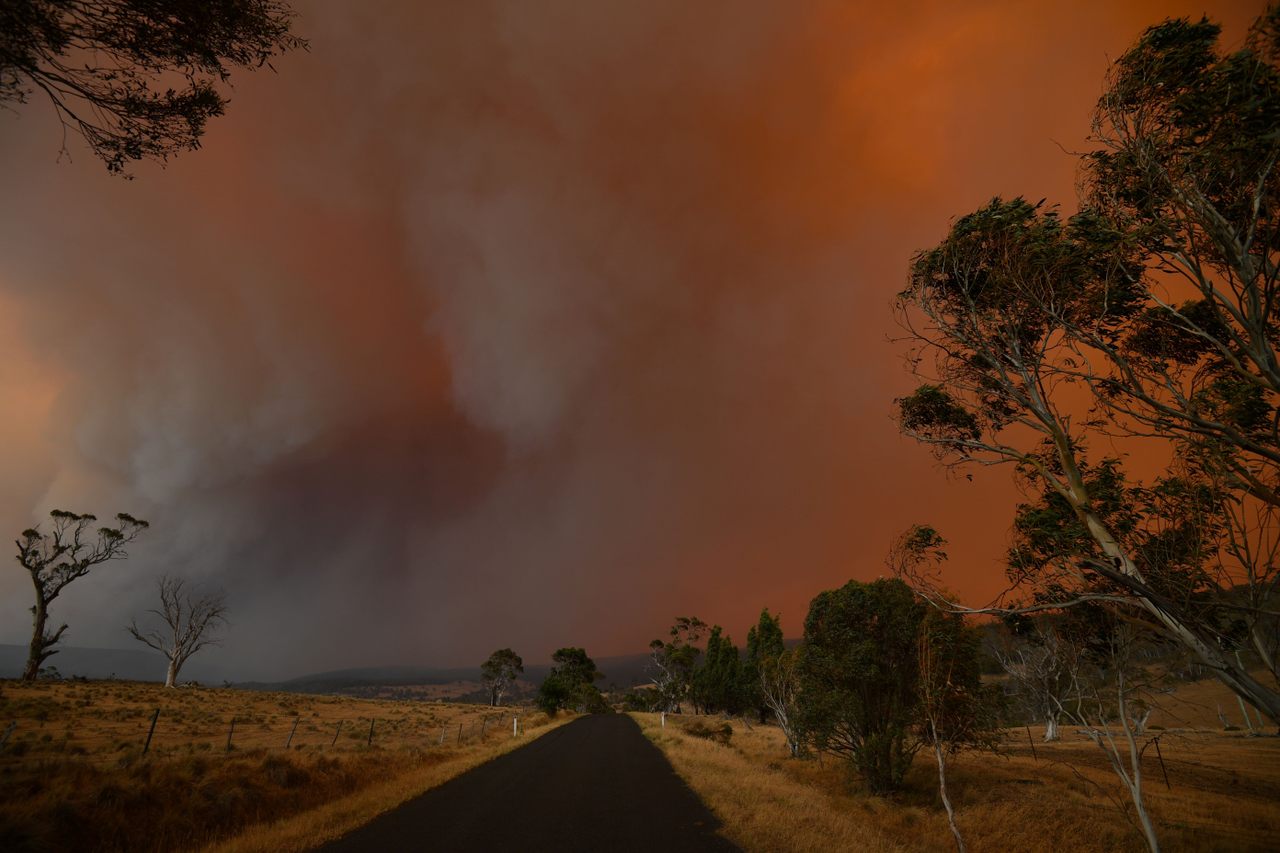
As massive bushfires raged across eastern Australia in January 2020, a deadly haze settled over Melbourne, an obvious signal for residents to stay indoors. Bouncing over their heads, though, was a less conspicuous signal: Cellular data was flying through the air in an odd pattern, one that scientists may be able to use to better understand and predict severe smoke events in the future.
The cell signals above Melbourne were interacting with an atmospheric quirk known as a temperature inversion. Normally, you’ll find warmer temperatures near the ground, where the sun is heating the surface, and cooler temperatures higher up in the atmosphere. But, true to its name, a temperature inversion flips this.
When a layer of smoke rolled across the city, it absorbed the sun’s energy, keeping much of that radiation from heating the surface. This created a layer of hot, dry, smoky air that sat atop the cooler air at ground level. “You have this double process,” says Monash University atmospheric scientist Adrien Guyot, lead author of a new paper in the journal AGU Advances describing the research. “You have the warming up of the layer, and the fact that the ground is not being warmed as it is normally.”
This did weird things to the signals transmitting between the cellular antennas atop Melbourne’s buildings. (Guyot and his colleagues were looking specifically at antenna-to-antenna communication in the network, not at how people’s mobile phones were connecting to them.) Usually when these antennas talk to each other, the signal flies more or less straight between them. But a temperature inversion creates a kind of atmospheric cap, dramatically bending the signal toward the ground.
These are known as “anomalous propagation conditions,” meaning that a signal travels, well, anomalously. “It will bounce off the ground, and then go up again, and then bounce off the ground, and go up again. So it will get trapped in the inversion layer,” says Guyot. Because the signal is bouncing, the travel time between antennas is different than it would be under normal conditions, when its path is straighter. “And because it’s not always arriving at the same time, sometimes you have a high reception, sometimes you have a lower reception,” Guyot adds. “And it’s really clear in the signal.”

By looking at this cellular data, then, Guyot could identify when a temperature inversion had settled over Melbourne as Australia burned during that wildfire season. In addition to trapping those signals, the inversion layer also trapped smoke, thus creating a data record as the city’s air quality became the worst in the world. In the future, Guyot thinks, it could be possible to monitor those cell signals for indications about where an inversion might be forming and how severe it might be. That would give officials a better idea of how rapidly air quality might be degrading. “If you have a temperature inversion, and if this inversion is strengthening, then you’re more likely to have an increase in the concentration of smoke as well,” says Guyot.
Imagine dumping food coloring in a kiddie pool versus an Olympic pool—even with the same amount of dye, you’ll get darker water in the smaller body of water than the big one. The same goes for condensed smoke that’s trapped in a thin layer of air near the ground, compared to smoke that’s diffusing more widely in an open atmosphere. “Having these inversions means that the smoke doesn’t get transported to higher altitude,” says Rebecca Buchholz, an atmospheric chemist at the National Center for Atmospheric Research, who wasn’t involved in this new work. “So it stays close to the ground, gets highly concentrated, and there’s more pollution at the ground that can impact humans.”
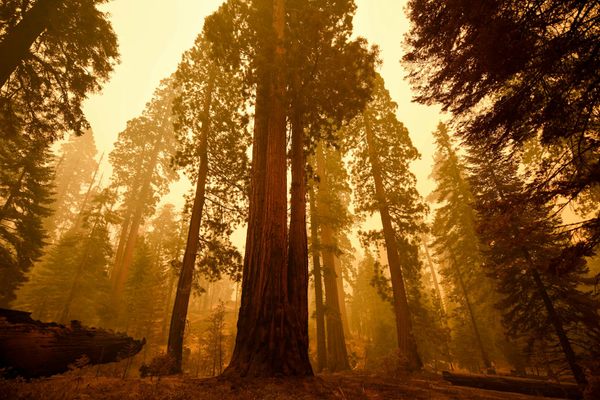
This smoke is awful for even healthy human lungs, much less for people with preexisting conditions like asthma: Haze from Australia’s 2019-2020 bushfire season killed an estimated 445 people. Smoke from the massive wildfires that burned across California in August and September of 2020 may have killed up to 3,000 people, according to one estimate. The haze was so bad last September that it turned the Bay Area orange.
To be clear, Guyot’s paper is still very early research, and it’s not meant to replace traditional methods of monitoring air quality—it’s more of a possible complement to them. Satellite images can give scientists a detailed view of how a smoke plume is traveling. Modeling can predict where the smoke will end up before it even gets there. But the cellular detection method could provide additional data without having to build out new infrastructure. “It’s really exciting if we can actually use data from existing cellular networks to feed our forecasting models with high-resolution data to combine with satellite and weather,” says atmospheric chemist Rebecca Hornbrook, who studies wildfire smoke at the National Center for Atmospheric Research but wasn’t involved in the new research. “It could be really helpful.”
Scientists and public health officials rely on air quality instruments that take samples to precisely quantify how much particulate matter—tiny bits of charred material—we’re breathing in at ground level. But those instruments are expensive, and researchers tend to place them in urban areas where the most people are. Cellular antennas, on the other hand, are everywhere, and tapping into them is cheap.
“It’d be basically an extension of air quality monitoring at very low cost, with signals that are already there and just not being used,” says atmospheric scientist Brett Palm, Hornbrook’s colleague at the National Center for Atmospheric Research, who also wasn’t involved in this new work. Monitoring these signals for indications of inversions could extend to remote areas beyond Melbourne, or elsewhere in the world, where scientists haven’t deployed smoke-sensing instruments. As long as the area has cellular antennas, the network is producing atmospheric data that could potentially help alert public health officials to plummeting air quality.
That’d be a good call, to be sure.








Follow us on Twitter to get the latest on the world's hidden wonders.
Like us on Facebook to get the latest on the world's hidden wonders.
Follow us on Twitter Like us on Facebook